• ARKANSAS JULY 2026

    Part of Something Bigger

    UNITED LABOR UNIONS LOCAL 100 IS PROUD TO STAND WITH ARKANSAS WORKERS

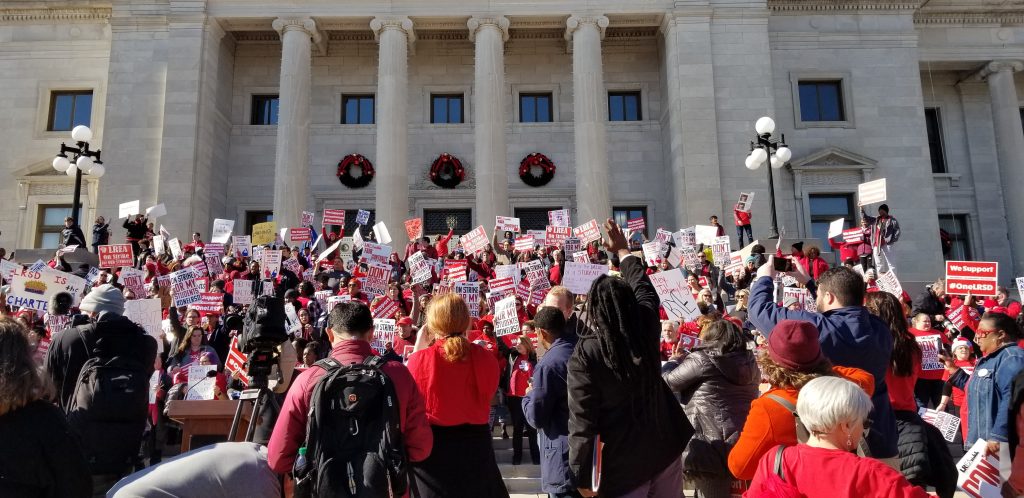
    Photo for United Labor Unions, Local 100
    This is the first issue of a newsletter for members of United Labor Unions Local 100, City of Little Rock workers, State of Arkansas employees, University of Arkansas for Medical Sciences (UAMS) and Central Arkansas Library System staff. This union exists because working people across our city are stronger standing together. For our City of Little Rock members, this past year brought real gains. Local 100 has pushed for fair compensation and better working conditions for municipal employees, and that work is paying off. Local 100 isn’t new to this work. Founded in 1980 in New Orleans by Hyatt hotel and Tulane University workers, the union proved organizing could win in the South. After affiliating with SEIU in 1984, Local 100 organized school support staff across Louisiana, healthcare workers in Arkansas and Louisiana hospitals, and Head Start workers across Texas, Louisiana, and Arkansas. In 2009, Local 100 became independent again, giving members direct control of their union. Today we represent workers across Louisiana, Arkansas, Texas, and Mississippi, and remain connected to ACORN International, part of a global network of community organizations.
    Our reach extends to the airwaves too. Local 100 is a proud partner of KABF 88.3 FM, “The Voice of the People,” a 100,000-watt community radio station broadcasting across Arkansas since 1984. Our Field Director, Toney Orr, currently chairs KABF’s board, giving our members a real platform to be heard. Whether you work for the City, CALS, the State of Arkansas or UAMS, you’re joining a union with decades of experience winning for working people. Welcome to the first issue.

    The Librarians are Organizing!

    CALS STAFF ACROSS CENTRAL ARKANSAS JOIN LOCAL 100

    Branch by branch, something new is growing inside the Central Arkansas Library System. Over the past month, library workers across CALS have been quietly and steadily organizing with United Labor Unions Local 100, and in recent weeks that momentum has accelerated. Members have now come forward from 9 of CALS’s 15 branches, representing a broad cross-section of the system’s dedicated staff. “There’s a lot of enthusiasm for the union. For having a voice, for the protection that standing together provides,” said Greg Moore, organizer for ULU Local 100.
    This organizing effort isn’t happening in opposition to CALS. It’s happening because library workers believe in the mission of this system and want to see it succeed for the long haul. That means building a real, working partnership with the Library Board and the Administrative office, one where staff have a voice when decisions are made about the policies and conditions that shape their daily work.
    A stronger, more stable workforce is good for CALS patrons, good for the branches, and good for the system as a whole. The union is about protecting the CALS librarians as professionals, as the people who do the daily work on the front lines to make the library run. It will give a voice to issues that matter most to staff, from consistent application of personnel procedures to safety concerns to simply having a clear channel for feedback to be heard. The goal is a library system where the people who keep it running every day have a real voice in how it’s run.
    United Labor Unions Local 100 is proud to stand with CALS staff and we look forward to working with the administration.

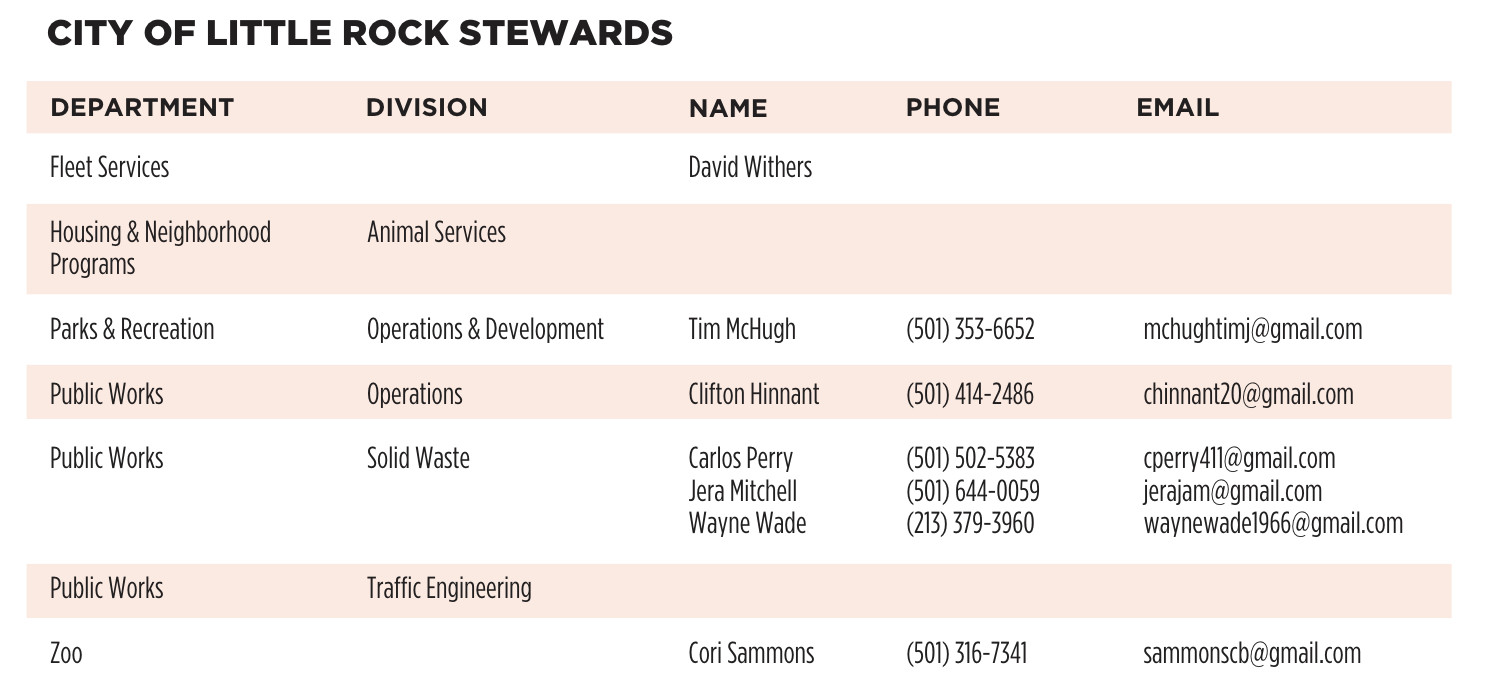
    Your Union Stewards are Here to Help


    Your union steward is your first point of contact when you have a question, a concern, or a problem at work. Whether it’s a disciplinary issue, a question about your rights, or just something that doesn’t feel right, your steward is there to listen and help you figure out next steps. You don’t have to do this alone! That’s what the union is for.

    If you are interested in getting trained to be a steward in your department, contact the union!

    Did You Know? City of Little Rock Workers Can Use Their Work History to Boost Their Pay!

    SUBMIT A RESUME TO APPLY FOR A HIGHER SALARY TODAY

    If you work for the City of Little Rock and you’ve been wondering whether there’s anything you can do to move up the pay scale, the answer might already be sitting in your work history. According to the City of Little Rock’s Compensation Manual, your prior work experience can factor into your salary.

    What This Means for You

    A detailed resume or work history document that lists your previous employers, job titles, dates, and responsibilities can move you up the steps to a higher pay grade. simply submit a resume of your work experience starting with 18 years of age.
    Steps to Take Right Now 1. Review the Compensation Manual. The City of Little Rock publishes its pay scales and compensation guidelines online. 2. Build a complete work history. Don’t leave anything out. List every job you’ve held, including dates of employment and a clear description of your duties. All of it counts toward your equity score. 3. Make sure you put in your whole work history when applying. When applying through the City’s job portal (governmentjobs.com/ careers/littlerock), include all of your work history.
    4. Ask about reclassification. If your job duties have expanded over time but your pay grade hasn’t budged, you may qualify for a reclassification. Contact HR at (501) 371-4590 to ask about the process. 5. Talk to your union rep. ULU Local 100 is here to help members navigate this process. If you have questions about your pay grade, your options, or how to document your experience effectively, reach out to us.
    City of Little Rock Launches New Career Pathway for Traffic Signal Technicians
    If you have questions or want help putting together your work history, contact Local 100 at (501) 247-3869

    City of Little Rock Launches New Career Pathway for Traffic Signal Technicians

    The City of Little Rock has established a new, standardized career pathway for traffic signal personnel, creating a clear and structured route for advancement while ensuring safe, reliable signal operations across the city. The program is competency-based, meaning promotions are tied to demonstrated skill and industry certification rather than time alone. It consists of three progressive positions. Apprentices spend up to 24 months building foundational knowledge and safety skills before advancing through a written and hands-on exam, along with IMSA Level I certification.
    Technician I staff develop independent maintenance and troubleshooting skills over 18 to 36 months, advancing through exams, leadership training, and IMSA Level II certification. Technician II represents advanced diagnostics, programming, and leadership responsibilities. Training is self-directed, built around the Traffic Signal Maintenance Handbook (TSMII), 2nd edition, and reinforced through two outside vendor training sessions annually, one IMSA certification class per year, ongoing on-the-job training, and check-ins at least every six months. Employees who maintain a valid Commercial Driver’s License are also eligible for a $3,000 annual incentive payment.
    This pathway ensures traffic signal workers are properly compensated for their expertise and gives them a real avenue for advancement. Local 100 is excited to work with the City to develop similar career pathways in other departments.

    From the Field Director’s Desk

    ULU Local 100 Field Director Toney Orr

    One question I hear often is: What is the union doing for me? My answer is always the same — I ask it right back: what are you doing for the union? It’s been ten months since Local 100 took over representation of the City, and change has never been easy. In the beginning, it felt like running around like a chicken with its head cut off! We kept trying to plug leak after leak left behind by years of miscommunication, misunderstanding, and, at times, a lack of cooperation from the city. I’m grateful to the members and stewards who helped us get through those first months.
    Now we’re starting to level out, and we’re seeing real progress — not just in wages, but in policy changes, in the compensation and equity studies, in a new seniority policy, and in holding management accountable to the goals we set at our first bargaining session. Does that mean we’re satisfied? No. Does it mean we’re complacent? No. There is still so much work ahead, and changing a culture takes time. But it is happening. None of this would exist without the employees who first came to us wanting something different. Andrew Brewer, Carlos Perry, Kashanda Perry, Curtis Cunningham, Justin Marin, David Withers, Karla Parker and Helen Peaster made up our original negotiating team for the City of Little Rock, and their hard work opened the door not just for our city members, but for the momentum we’ve since built with the Central Arkansas Library System and beyond.
    Going forward, you’ll see this newsletter every month, along with suggestion boxes and a Member of the Month feature. We’re also working with our stewards to lock in a regular time for monthly membership meetings, so stay tuned and keep the questions coming!

    TUESDAY, AUGUST 11 / 6PM 2101 S. Main St. Little Rock

  • Local 100 Election Slate – 2025 to 2028

    The Local 100 Executive Board acting as a Nominating Committee of the whole has completed and recommended a full slate making sure that all areas of the union are represented and all vacancies created by movements out of our jurisdiction are now filled.   The slate is as follows:

    President Henrietta Collins (Human Development Arkansas – Warren, AR)

    Vice-President Ami Rodriguez (Gulf Coast CCA – Houston, TX)

    Secretary-Treasurer Toney Orr (Local 100 ULU – Little Rock, AR)

    Executive Board Carmond West (HISD – Houston, TX)

    Executive Board Jackie Dartez (LARC – Lafayette, LA)

    Executive Board Michael Courtney (Sevita – Baton Rouge, LA)

    Executive Board Andrew Brewer (City of Little Rock – Little Rock, AR)

    Executive Board Redonia Harshaw (UAMS – Little Rock, AR)

    Executive Board Billy Johnson (Caddo Parish CAA – Head Start – Shreveport, LA)

    Executive Board Anita Bell (ABM – New Orleans, LA)

    Chief Organizer Wade Rathke (Local 100 ULU – New Orleans, LA)

    Nominations are now open to any other qualified member (a dues paying member for the last 2 years who submits sufficient signatures on a qualifying position to run according to Local 100 Constitution and Bylaws) until March 15th and must be received by the close of business that date at 2221 St. Claude Avenue at our headquarters in New Orleans.

    If there are no additional nominations for any position, the slate will be elected unanimously.  If nominations are received for any particular position, then ballots will go out for voting to take place by March 15th.  The new terms will run from 1/1/25 through 12/31/27.

    Thanks to all Local 100 members for your participation.

    \

  • Hospital Price Transparency and its Implementation in Arkansas, Louisiana, and Texas
    It’s not just individual patients who are in the dark… Employers are in the dark. Governments are in the dark. It’s just astonishing how deeply ignorant we are about these prices. Martin Gaynor

    Summary

    • A year after its implementation, the government’s price transparency regulation is failing. The government requirement that hospitals begin disclosing their prices is not helping patients. With no meaningful penalties for non-compliance, and no standardization as part of the regulation, hospitals are reporting the prices in wildly different ways, if at all. Moreover, the industry preference for consumer price tools are woefully inadequate even when they “work,” as hospitals do not report estimates within any kind of reasonable range.
    • The government and hospitals could both improve it. Health prices are complex because of unique features of our market-based healthcare system, but the price transparency regulation would be significantly improved with three key changes: requiring insurers to begin disclosing reimbursement data, instituting significant penalties for hospitals and insurers who fail to comply, and requiring both a set coding system and plain language descriptions of procedures.
    • Patients are still in the dark about their estimated costs. Transparency on procedure costs for patients remains low. A minority of hospitals in Arkansas (33%), Louisiana (42%), and Texas (30%) have truly accessible price estimation tools. And among those that do have accessible tools, the range of the estimates can vary so widely as to make them useless.
    • Charges hospitals set are all over the place. There is massive variation in the charges set for procedures between and within all groupings of hospitals.
    • For-profit hospitals set their charges higher than non-profits and government hospitals in Texas and Arkansas, but in Louisiana non-profits’ charges are much closer to for-profits.
    • Texas hospitals set the highest charges of the three states, followed by Louisiana and then Arkansas.
    • The metro areas with the highest list prices in each state are Fayetteville-Springdale-Rogers (Arkansas), Lake Charles (Louisiana), and Longview (Texas).
    • ACORN stands ready to help researchers and patients in these three states get better understandings of the costs of care. 
    It’s so convoluted right now that … nobody can do a comparison across hospitals because every hospital is reporting differently. Anonymous health industry executive


    Introduction

    As of January 1, 2021, the Centers for Medicare and Medicaid Services (CMS) began requiring most American hospitals disclose information about the prices of their services on their websites. Hospitals have since produced an ocean of new data to comply with this rule. In Texas, Arkansas, and Louisiana, where we studied this data, we found it to be incomplete, totally lacking in uniform standards, and riddled with inaccuracies. Varieties in hospitals’ methods for setting charges, and varieties in how they report those charges, mean that apples to apples comparisons are difficult. Nevertheless, given the dearth of studies seeking to use this new information to draw conclusions about trends in healthcare, we endeavored to wade through it and report our findings. While apple to apple comparisons might not be possible given the current landscape, we believe we have identified real trends at the “bushel” level. Indeed, we hope that our study will help prompt government and/or industry action to produce new and more uniform information–information that is actually useful to the patients they serve.

    Our study of hospitals’ data in Texas, Arkansas, and Louisiana, shows that the price transparency regulation falls far short of its stated goal of shedding light on healthcare costs for the following key, rectifiable reasons:

    1. The regulation is inadequate in scope: Healthcare costs are not determined by providers alone, but via a process of negotiation between healthcare providers and payers–private and public (Medicare and Medicaid) insurances. Because the regulation does not require insurers to disclose information about their side of the deal, we are only seeing one side of the information we’d need to make reliable and specific estimates about the actual cost of care for patients.
    2. The regulation carries no significant penalties for noncompliance: Hospitals are frequently failing to comply in good faith with the spirit of the regulation–providing unnecessarily complex lists and inadequate tools if they provide them at all. The rare exceptions to this trend show us that good faith compliance is, in fact, attainable.
    3. The regulation itself fails to set standardized requirements for reporting, making direct and meaningful comparisons between hospitals inordinately difficult. The government’s failure to require the use of a standard coding system for procedures or require plain language descriptions of procedures has allowed this area to be yet another free-for-all in the American healthcare system, with as many variations in compliance as there are individual hospitals. The regulation should require plain language and move hospitals toward standardization of coding.

    Despite the failings of the regulation, we are confident about certain trends. Overall, there remains a glaring lack of transparency from hospitals. While most have made at least some form of machine-readable price file available, many of those are not compliant with the basic requirements of the regulation. And only a minority have made truly accessible tools that consumers can use to compare prices–33% in Arkansas, 42% in Louisiana, and 30% in Texas. Even when those tools are accessible, the estimates provided often range so widely as to be useless.

    Our survey shows that Texas hospitals set the highest charges of all three states, followed by Louisiana and then Arkansas. While non-profit hospitals tend to set lower charges than for-profits in Arkansas and Texas, the same can’t be said for Louisiana. There, the non-profit hospitals’ average charges are close to or greater than for-profits.

    We identified metro regions with the highest charges in each state: in Arkansas, Fayetteville-Springdale-Rogers, in Louisiana, Lake Charles, and in Texas, Longview. However, perhaps more relevant is the extent to which costs vary wildly within each metro region.

    Despite complaints from the hospital industry about the administrative cost of complying with the regulation, we did not find noticeable trends correlating hospitals’ revenue with compliance. In other words, we find no evidence that richer hospitals are more inclined or capable of complying than are poorer hospitals.

    We found that price comparison tools were only truly accessible at 33% of Arkansas hospitals, 42% of Louisiana’s, and 30% of Texas’s. Of that minority whose tools were accessible, unfortunately, the estimates were often useless.

    Background

    The government rationale for the price transparency rule is straightforward enough: healthcare costs continue to rise unabated, and requiring healthcare providers to disclose their prices to the public will help to bring down those costs by enabling comparison shopping. Think of it this way: If the only way you could purchase bread was by getting billed after eating it, and everyone got billed different amounts, bakers might be able to set all kinds of high prices for bread. Our ability to see the prices of breads before purchasing the one we want allows us to pick one that’s reasonably priced. The aggregate of those individual decisions (i.e., consumer demand) ought to interact with the aggregate of the bakers’ individual bread-making costs (i.e., supply) such that prices stabilize. Bread’s cost might fluctuate due to disruptions in bakers’ ability to supply it, but at least prices won’t grow year after year just because no one knows the price of the bread until after they eat it.

    In other words, hopefully, the idea is that “price transparency” would make health costs more like bread costs.

    However, healthcare is different from most goods and services in several fundamental ways.

    If healthcare is a commodity because we pay for it, then it is closer to commodities like funerals or repair services after a disaster than goods we buy in a store. The need for healthcare arises universally but unexpectedly, with costs generally beyond an individual’s ability to pay for them. Thus, people began pooling their resources, paying a bit into the pool at regular intervals in exchange for access to that pool in the moment of need–insurance, in other words. Prices, then, are not set so much by the relationship between the consumer and provider so much as the insurer and the provider. Insurers want to keep prices lower to minimize what they pay; providers want to get prices higher to maximize their profits. At the same time, the fact that services are insured make them more accessible than they would be if they all had to be paid for out of pocket, which pushes demand and prices up.

    In the United States, there is additional complexity: multiple insurers that compete with each other to pay multiple providers for healthcare costs. This is in contrast to a socialized healthcare system where the government is the main provider of service, as in the United Kingdom, or a single payer system where government insurance pays the costs to multiple providers, as in Canada. If everyone was in one insurance pool, the administrators of that pool would have more leverage with providers to keep prices lower. Consider that most hospitals simply cannot afford to turn down Medicare and Medicaid patients because there are just so many of them. The flip side is that hospitals have to then accept the government’s set rate of reimbursement and comply with CMS regulations, such as the price transparency rule. Recall private insurance companies’ fears during the Obamacare debate that a “public option” would end up out-competing private insurance, due in part to its ability to leverage a potentially massive pool of insured people.

    The complexity of endless negotiations between insurers and providers produces inefficiencies. Consider just one of the many Russian nesting dolls of problems unique to our system:

    [I]n efforts to negotiate better prices, insurers must be able to “threaten” to (and often do) exclude some clinicians or health care centers from their network. As a result, administrative dollars are spent to help find in-network clinicians or health care centers or steer patients to the lower-priced clinicians or health care centers in the network. Several industries have emerged to manage network and benefit complexity (e.g., firms that support patients as they navigate their network and their benefit design, as well as firms that support employers in designing benefits and choosing insurers). The associated administrative costs are spread across payers, clinicians and health care centers, employers, and even patients.1

    Little wonder that administrative costs make up an estimated 34% of American healthcare costs, as opposed to 17% of Canada’s2. In fact, the number of jobs supplied by the healthcare administration is itself a significant political barrier to efforts to reform and simplify healthcare delivery. The ballooning cost of healthcare is a long-term problem, but politicians are loath to make reforms that would lead to immediate job losses in its administration3.

    The upshot is, healthcare prices are extremely complex and varied not just because they aren’t transparent, but due to the basic market set-up of our healthcare system.

    The price transparency rule aims to start shining a light on this complexity–a flashlight lighting up thick layers of cobwebs. The rule itself has two main parts. One, hospitals have to provide systematic lists of all their prices in formats that can be processed by a computer (“machine readable files”). Hospitals often refer to this list as a “chargemaster” or list of standard prices. Two, they have to provide a “consumer friendly” list of the kind of common procedures a person could theoretically shop for in advance (“shoppable services”). But a hospital doesn’t set just one price for each procedure. It negotiates a different price with each individual insurer and sets another price for people paying directly without insurance (the “cash discount” or “self-pay” rate). All of this is separate from the rates government insurance pays hospitals for a procedure.

    So, the CMS regulation requires hospitals to publish the following four prices for each procedure in their systematic lists:

    1. What the hospital sets as its initial “charge,” list price, or gross cost. Think of this more as the hospitals’ starting point for their negotiations with insurers.
    2. The highest rate the hospital has negotiated with a given insurer for a given procedure. They don’t have to identify which insurer this is (thus, a “de-identified maximum”).
    3. The lowest rate the hospital has negotiated with an insurer (“de-identified minimum”) for a procedure.
    4. The ‘cash discount’ price hospitals charge people without insurance or people who ‘self-pay’.

    For instance, Texas’s Good Shepherd Medical, Longview, is compliant with this part of the regulation and lists the following prices for hernia repair:

    • gross: $42,608.45
    • min negotiated: $2,650.54
    • payer specific negotiated: $10,450.28
    • maximum negotiated: $10,450.28
    • cash price: $19,173.80

    The listing of prices for an endoscopy at Texas’s Baptist Medical Center (San Antonio) provides a striking visual example of how much these different prices for the very same procedure can vary. The minimum negotiated price the hospital negotiated with an insurer for an endoscopy is $614.51, the maximum is $4069.19, the cash discount (what an uninsured person would get billed) is $15,820.51, and the gross charge is $21,094.01. Once all the additional costs and codes are factored in, the cost to the patient/insurer presumably lies somewhere in this range:

    This is the kind of range of costs presented by hospitals who are in compliance with the CMS requirements for machine readable files. But the level of compliance with this requirement ranges widely, with as many permutations of price reports as there are hospitals. Many hospitals have elected to publish only one price for each procedure in their machine-readable file–the list, or “standard,” price. Others publish far more, with vast spreadsheets or text blocks noting the price paid by each insurer for each medical variation of the same procedure.4

    Indeed, there is no uniformity around how a medical procedure should be listed, or how many variations of it are permissible to include in the listing. Does the cesarean section include sterilization, complications, comorbidities? Is the appendix removed with a laparoscope or open incision? Is the hip replacement due to hip fracture or not? All these factors might, or crucially, might not, affect how a hospital sets or reports its rates. Sometimes the procedures are systematized by one of the several insurance billing code systems, other times they are not. Some hospitals will tell you the rates for a dozen different varieties of endoscopies, others only one. A text search of Raceland, Louisiana’s Ochsner’s St. Anne’s chargemaster for “appendectomy” produces 289 results, for instance–with separate entries for each insurer and variety. A few hospitals even separate out various components and materials of charges which one would need to add up to get to a full rate.

    Consider the rich variety of prices listed by USMD Arlington, in Texas, for a specific billing code of a cholecystectomy (gallbladder removal). They are delineated by insurance plan type:

    Often, however, the reason for a different coding of a procedure, which leads to a different price, was not explained, as in the case of Danville, Arkansas’s Chambers Memorial Hospital:

    Part of this particular issue is related to yet another specifically American quirk of complexity: the ever-growing, ever more lucrative systems of medical coding that have reached dizzying levels of intricacy5:

    [T]he complex system of billing and coding that underlies bills…with its lines of alphanumeric codes and arcane medical abbreviations, has given birth to a gigantic new industry of consultants, armies of back-room experts whom medical providers and insurance companies deploy against each other in an endless war over which medical procedures were undertaken and how much to pay for them… Toward the end of the 20th century and into the next, as strategic coding increased, a new industry thrived. For-profit colleges offered medical-coding degrees, and internships soon followed. Because alphanumeric coding languages are as distinct from one another as Chinese is from Russian, different degree tracks are necessary, along with distinct professional organizations that offer their own particular professional exams, certifications and licensing. Hospital systems and insurers — which have become huge, Hydra-like enterprises — now all employ roomfuls of coding-program graduates to perform these tasks. Membership in the American Academy of Professional Coders has risen to more than 170,000 today from roughly 70,000 in 2008.

    Consider a usage of the most common coding system, the American Medical Association’s proprietary Current Procedural Terminology (CPT®) system, at Mercy Hospital Boonville in Arkansas. It delineates separate or different charges for “obstetric care/c-section” (code 59510, $2,100), “cesarean delivery only” (code 59514, $1,024.31), and “cesarean delivery care” (code 59515, $1,407.51):

    So, the coding systems used by different hospitals are themselves complex. But worse, from the point of view of the consumer’s understanding, hospitals weren’t even required to use a coding system in their published chargemaster or to make it clear what each procedure is. Right now, as noted by a government guide to compliance prepared for hospitals, “there is no requirement for the description in your machine-readable file to be in plain language; you may consider using the short description associated with corresponding billing codes, or the short description used in your hospital’s chargemaster, or another type of description.”6

    Additionally, while many hospitals provided a machine-readable file in familiar file formats–Excel spreadsheets or pdf files–many elected to provide the data in a programmer specific format known as “json” files. Here’s an example of what one such file from Baxter Regional Medical Center, in Mountain Home, Arkansas, looks like:

    On the way to finding these files on their websites, many hospitals make a patient or investigator wade through paragraphs of dense legal text that argue that their standard prices have little useful information. In Louisiana, a number of hospitals had copy-pasted the same block of text that appeared to be drafted by the Mississippi Hospital Association, the organization behind a linked video that “explained” price transparency.7 The video trashes the CMS rule and speciously explains away the variability of healthcare costs as being akin to airline tickets, as if the prices simply varied due to fluctuations in supply and demand. The thrust of the text is always similar: this document is pointless, it will not tell you how much you are likely to have to pay, don’t hold us to these numbers because it’s very likely you will end up having to pay more. We kept these admonishments in mind for our methodology and whenever possible, used the highest quoted price in our comparisons.

    Frequently, the hospital’s disclaimer text would encourage the reader to try out the hospitals’ preferred method of “transparency:” a separate website portal where you put in your name, insurance, and type of procedure, and you get an estimate for that procedure’s cost back. CMS has allowed hospitals to use these tools in lieu of publishing a “consumer friendly” list of “shoppable services” — the second main part of the regulation. According to the above quoted hospital executive, “Providing patients with estimates, I think that’ll stick. That’s something hospitals will do even without a rule [and] I think we’re already past that issue by and large.”

    But as our analysis shows, most hospitals in our three surveyed states either have not made such a tool, require onerous amounts of information to use it, or have a tool that only shows prices for a limited number of services. We found that such tools were only truly accessible–findable and gettable without having to enter your health insurance ID numbers–at 33% of Arkansas hospitals, 42% of Louisiana’s, and 30% of Texas’s.

    Of that minority whose tools were accessible, unfortunately, the estimates were often useless. This estimate for the cost of a hip replacement at Highland Medical Center, in Shreveport, Louisiana, which has a tool we rated as “Accessible,” ranges from $9,714 to $192,016. That’s a span of $182,302.

    Much rarer was the tool that provided a clear, itemized set of estimates. Franklin, Louisiana’s Franklin Foundation Hospital stood out for its clarity above nearly all the rest:

    Methodology

    As a New York Times’ investigation of hospital price transparency data put it, “hospital and insurers didn’t want you to see these prices,”8 let alone compare them. Perhaps it’s for this reason that there are studies of the range of costs for procedures9, but fewer comparing the costs between different sets of hospitals.

    Nevertheless, we refused to let complexity of the industry’s making deter us from analyzing trends in the industry, even if that complexity makes our measurement tool blunt and imperfect. Greater uniformity in charge reporting, whether undertaken due to industry or government pressure, will lead to greater accuracy.

    So, we built lists of hospitals in Louisiana, Texas, and Arkansas, starting from state lists provided by the American Hospital Directory. We added additional campuses or sites and removed closed or inactive hospitals as we searched for each hospital’s website. We followed the Directory’s categorizations of these hospitals’ “ownership types” — that is, whether they are owned by a non-profit corporation, a corporation organized to provide returns to shareholders (including physicians), or overseen by a governmental authority. From those lists, we began to track who was compliant with the CMS rule. When they weren’t, we filed complaints with CMS–178 complaints across our three target states10. Then, we went back and located files from newly compliant hospitals and began analyzing all available lists of standard prices in the three states– 86 hospitals in Arkansas (70% now provide some kind of machine-readable file), 121 in Louisiana (77% have a machine-readable file), and 392 in Texas (90%). We have compiled each of these files into a central location and are providing them to the public to expedite additional research and comparison shopping.

    From an initial list of 30 common procedures that we collected data for, over time we settled on five that were relatively uncomplicated in their coding, appeared in many hospitals’ data, and which we felt confident could be compared across hospitals: a cesarean section, an upper GI-endoscopy (EGD/esophagogastroduodenoscopy with brush wash), hip replacement (arthroplasty), laparoscopic gallbladder removal (cholecystectomy), and colonoscopy with biopsy. We aimed, whenever possible, to choose the charges for the versions of these procedures without complications.

    The array of prices for every procedure at every hospital made arriving at a consistent variable difficult to compare and contrast difficult. Our researchers several times found that after having collected a ream of data on what we felt was reasonable to compare, a new piece of information showed us that it was not. For instance, we ended up not using our appendectomy price lists to make comparisons because we found major price variation between two methods of appendectomy, methods which were sometimes but not always specified by the hospital.

    However, we took nearly every hospital’s admonishment that costs could always be higher than the estimate as helpful methodological advice. Whenever the hospital listed only one price–the list/standard/gross charge–we used that. But, for instance, at Christus Shreveport, the gross charges listed by the hospital for a hip/knee replacement are $91,169.90, The hospital managed to fetch a higher rate from at least one insurance company so its “de-identified maximum” for the same procedure is $164,815.60. In this as in other cases, we took the higher of the two prices.

    Meanwhile, at Children’s Hospital New Orleans, the price of the same procedure has a gross of $251,182.00 while the de-identified maximum is lower–which is more typical– at $195,921.96. Again, we used the higher of the two listings.

    Therefore, while pinpointing the cost of the procedure at either hospital is impossible, it is reasonably certain that it would cost a person more at Children’s Hospital than it would at Christus Shreveport.

    For our analysis of the accessibility of the comparison price tools, our team divided them into four different categories: accessible, difficult to access, unavailable, or unreliable.

    “Unreliable” tools were those that didn’t give us price estimates for procedures we knew were available at the hospital, usually because they were listed in the chargemaster. For instance, Byrd Regional Hospital in Leesville, Louisiana proudly lists its full spectrum of maternity care offerings, but its price comparison tool says the hospital does not provide deliveries.

    Here the hospital shows its maternity care…

    “Unavailable” meant that we could not locate a comparison tool on the website within a few minutes of searching for one. We categorized a tool as “difficult to access” if it required someone to have their specific insurance member identifications and/or group numbers before receiving an estimate. “Accessible” meant that we could quickly find a procedure, enter an insurance plan, and get an estimate.

    Analysis

    We found median charges for our test procedures to be highest in Texas, followed by Louisiana, with Arkansas the lowest of the three. The average of medians for Louisiana’s charges was 17.2% higher than Arkansas’s; the average of medians for Texas’s charges was 47.2% higher than Arkansas’s.

    Louisiana had the highest level of transparency and accessibility, followed by Texas and then Arkansas. Government hospitals tended to have lower charges than hospitals run by private corporations in both Louisiana and Texas, but in Arkansas very few government hospitals provided charge information. Arkansas has the highest proportion of non-profit hospitals of the three states.

    Arkansas

    The set of 17 private, for-profit hospitals we surveyed in Arkansas had higher average charges for their procedures than their 55 non-profit and 14 government counterparts. For-profits had the highest average procedure charge for each of the five procedures we surveyed (see below). Government hospitals had higher charges than non-profits for 2 of the 5 procedures, but only 1 of the 14 government hospitals had complete price information, making the “averages” weighted heavily toward the charges set by the University of Arkansas Medical Center (Little Rock)–a government district hospital in the American Hospital Directory’s classification system.

    Helena Regional Medical Center was a high-cost outlier in the for-profit pool, reporting extremely high DRG average charges for each procedure, rather than the required set of charges. Thus, the average per case for a hip replacement charge was $115,580, while the average Medicare-insured pocket-cum-insurance payout was $13,785 for that procedure. We reached out to Helena regarding its price transparency but received no response. However, even with Helena Regional removed from the pool, the for-profit average was nearly twice that of non-profits.

    Only 7% of government run hospitals had accessible price comparison tools–due in part to the VA’s exemption from the price transparency requirements. 36% of non-profits were accessible, as were 30% of for-profit hospitals.

    Charges for the same procedures vary widely between but also within all metro areas, as is visually demonstrated by this comparison of colonoscopy charges across Arkansas:

    6 of Arkansas’s 17 for profit hospitals are in the Fayetteville-Springdale-Rogers statistical area–the majority of that area’s 10 hospitals– helping to make the metro area the one with the highest list prices in Arkansas.

    For instance, Hot Springs’ non-profit St. Vincent Hot Springs has a list price for a colonoscopy with biopsy of $1624. That is lower than any hospital’s list price for that procedure in the Fayetteville area. The lowest list price for a colonoscopy with biopsy there is $3,984, at Mercy Hospital of Northwest Arkansas, another non-profit.

    The below table ranks metro areas by the median charge of our 5 surveyed procedures, with all hospitals outside the listed metro areas grouped together as their own set.

    Louisiana

    Louisiana’s set of 36 non-profit hospitals had the highest across the board average for our 5 procedures– the state’s 43 for-profits’ average was 16% lower. The 42 government hospitals’ list price average came in 46% lower than that of the non-profits. This appeared to be due to the higher costs for two of our procedures, the hip replacement and endoscopy, in the pool of non-profit hospitals, as non-profits had lower averages for the other three procedures. However, the median of the 5 averages was highest for for-profit hospitals. Whatever way we look at it, non-profits are setting charges closer to for-profits in Louisiana than they do in either Arkansas or Texas.

    Government hospitals as a group had the lowest average list price for each of the 5 procedures we surveyed.

    As in Arkansas, charges per procedure vary widely within all metro areas, nowhere more so than in Lake Charles.

    Overall, Lake Charles had the highest charges for the five surveyed procedures. The highest gross charge for a cesarean section in Lake Charles is at Christus Ochsner Lake Area Hospital, $58,232.18, while the highest in Houma is at Ochsner Leonard J. Chabert Medical Center, $9,539.18. Majorities of hospitals in Lafayette (9 of 15) and Shreveport (7 of 10) had accessible price comparison tools, but in every other metro area and in rural areas, most hospitals’ tools were not accessible.

    Texas

    Of the three ownership types we categorized hospitals by, Texas’s set of 132 for-profit hospitals tended to have the highest charges, then its 181 non-profits, followed by its 79 government hospitals. The exception to this pattern was the laparoscopic gallbladder removal (cholecystectomy), for which non-profits had a higher average procedure charge.

    The TexasHealth system deserves special scrutiny because the charges listed in its chargemasters were uniform across its locations, which seems incorrect given that each of its patient tool estimates differed significantly. Those estimates were also significantly higher than what was reported in the system’s machine-readable files. We opted for the high end of the tool estimations for this system.

    There were a few metro areas in Texas where a majority of hospitals had accessible price comparison tools: Victoria, Amarillo, Waco, and Abilene. The rest did not. Longview had the highest median charge, while Middle Rio Grande had the lowest. The lowest gross charge for a cesarean section in Longview is $35,838.73 (Christus Good Shepherd Medical Center Longview), while in the Middle Rio Grande it’s $2,286 (Dimmit Regional Hospital in Dimmit).

    We had insufficient information from hospitals to report average costs in Bryan-College Station, Lubbock, Sherman-Denison, and Texarkana.

    As in Arkansas and Louisiana, costs range widely within each metro area for every procedure, including for colonoscopies:

    Acknowledgements

    A team of dedicated researchers made this report possible: Ryann Cohen, Rebecca Srour, Meagan Lee, Alison Hurwitz, Yuan Yueyue, Amanda Castillo, Ana Bergmann, Gracie Scott, Emma Sciarrone, Amelia Nugent, Isabelle Varone, Anna Washburn, Orion Howard, Gabby Chavez, Pooja Patel, Setah Alavia, Trey Gray, Emily Thompson, Julia Stern, Kelsey Liebman, and Khayin Maheia.

    David Thompson is research coordinator for the family of organizations that assembled this report, ACORN International, Labor Neighbor Research & Training Center, and Local 100 United Labor Unions. The full report and the data set is available at www.acorninternational.org and the websites of the partner organizations.

    Questions on the report or more information can be obtained by email from David Thompson research@chieforganizer.org or from Wade Rathke chieforganizer@acorninternational.org who initiated the report as part of a series of similar reports published in Social Policy on the failure of hospitals to provide charity care as required by the Affordable Care Act and the more recent report in Social Policy 51.4 on non-compliance with this CMS reporting requirement.

    Take Action and Follow-Up

    If you need help making it through the maze that we have described, contact us at www.acorninternational.org, www.laborneighbor.org, or www.unitedlaborunions.org for assistance!


    1 Chernew, Michael and Harrison Mintz, “Administrative Expenses in the US Health Care System: Why So High?” https://jamanetwork.com/journals/jama/fullarticle/2785479

    2 Himmelstein, Campbell, Woolhandler, “Health Care Administrative Costs in the United States and Canada,” Annals of Internal Medicine. https://pubmed.ncbi.nlm.nih.gov/31905376/

    3 https://www.politico.com/agenda/story/2016/07/what-is-the-effect-of-obamacare-economy-000164/

    4 See, e.g., Louisiana’s Lake Charles Memorial Hospital’s chargemaster, which lists some 52 prices for spinal fusion, or Madison Parish Hospital in Tallulah, Louisiana which lists just one.

    5https://www.nytimes.com/2017/03/29/magazine/those-indecipherable-medical-bills-theyre-one-reason-health-care-costs-so-much.html

    6 https://www.cms.gov/files/document/steps-machine-readable-file.pdf

    7 https://www.youtube.com/watch?v=LdX3Kny6lLk

    8 Kliff, Sarah and Josh Katz, “Hospitals and Insurers Didn’t Want You To See These Prices. Here’s Why,” August 22, 2021. https://www.nytimes.com/interactive/2021/08/22/upshot/hospital-prices.html

    9 For instance, this excellent study shows how wildly prices can vary for the same procedure in certain metro areas: https://www.healthsystemtracker.org/brief/price-transparency-and-variation-in-u-s-health-services/

    10 https://acorninternational.org/index.php/2021/11/30/complaints-filed-178-hospitals-fail-to-provide-federally-mandated-price-transperency/

  • Union Activity in the South Adds Fuel to National Labor Rights Discussion
    The President’s call to ‘join a union’ as well as Amazon workers’ fight for unionization in Bessemer, Alabama has re-ignited discussion about labor rights in the South.
    United Local 100 chief organizer Wade Rathke recently spoke to NPR about the process of starting a campaign to unionize, and why exactly it’s so difficult to win against big employers.
  • “Unions Put Power in the Hands of the Workers”
    On Sunday, President Joe Biden took to Twitter with a message for the workers in Alabama – and across America – that the decision to form a union is a right of the worker, and fully dependent on their own choice, not their employers. President Biden went on to state:
    There should be no intimidation, no coercion, no threats, no anti-union propaganda. No supervisor should confront employees about their union preferences. Every worker should have a free and fair choice to join a union. The law guarantees that choice. And it’s your right, not that of an employer, it’s your right.
    He continued:
    There should be no intimidation, no coercion, no threats, no anti-union propaganda. No supervisor should confront employees about their union preferences. Every worker should have a free and fair choice to join a union. The law guarantees that choice. And it’s your right, not that of an employer, it’s your right.
    Biden also spoke on the ability of unions to protect the worker against racial discrimination and sexual harassment, furthering the idea that unions not only protect your paycheck, but the whole of your workplace experience, and should serve as a means of collective and community support that corporations aren’t prepared to provide.